How strategic intent stays connected to what every team is actually doing.
Strategic choices, connected to who delivers them
Strategic choices stay connected to the objectives, teams, and commitments delivering on them. Every team translates strategy into their own context through structured execution plans. The picture stays current because that’s how the work is structured, not because someone assembled a report.
Strategic Choices
Upload strategy documents. AI decodes them into the Playing to Win framework and generates Strategic Intents linked directly to execution.
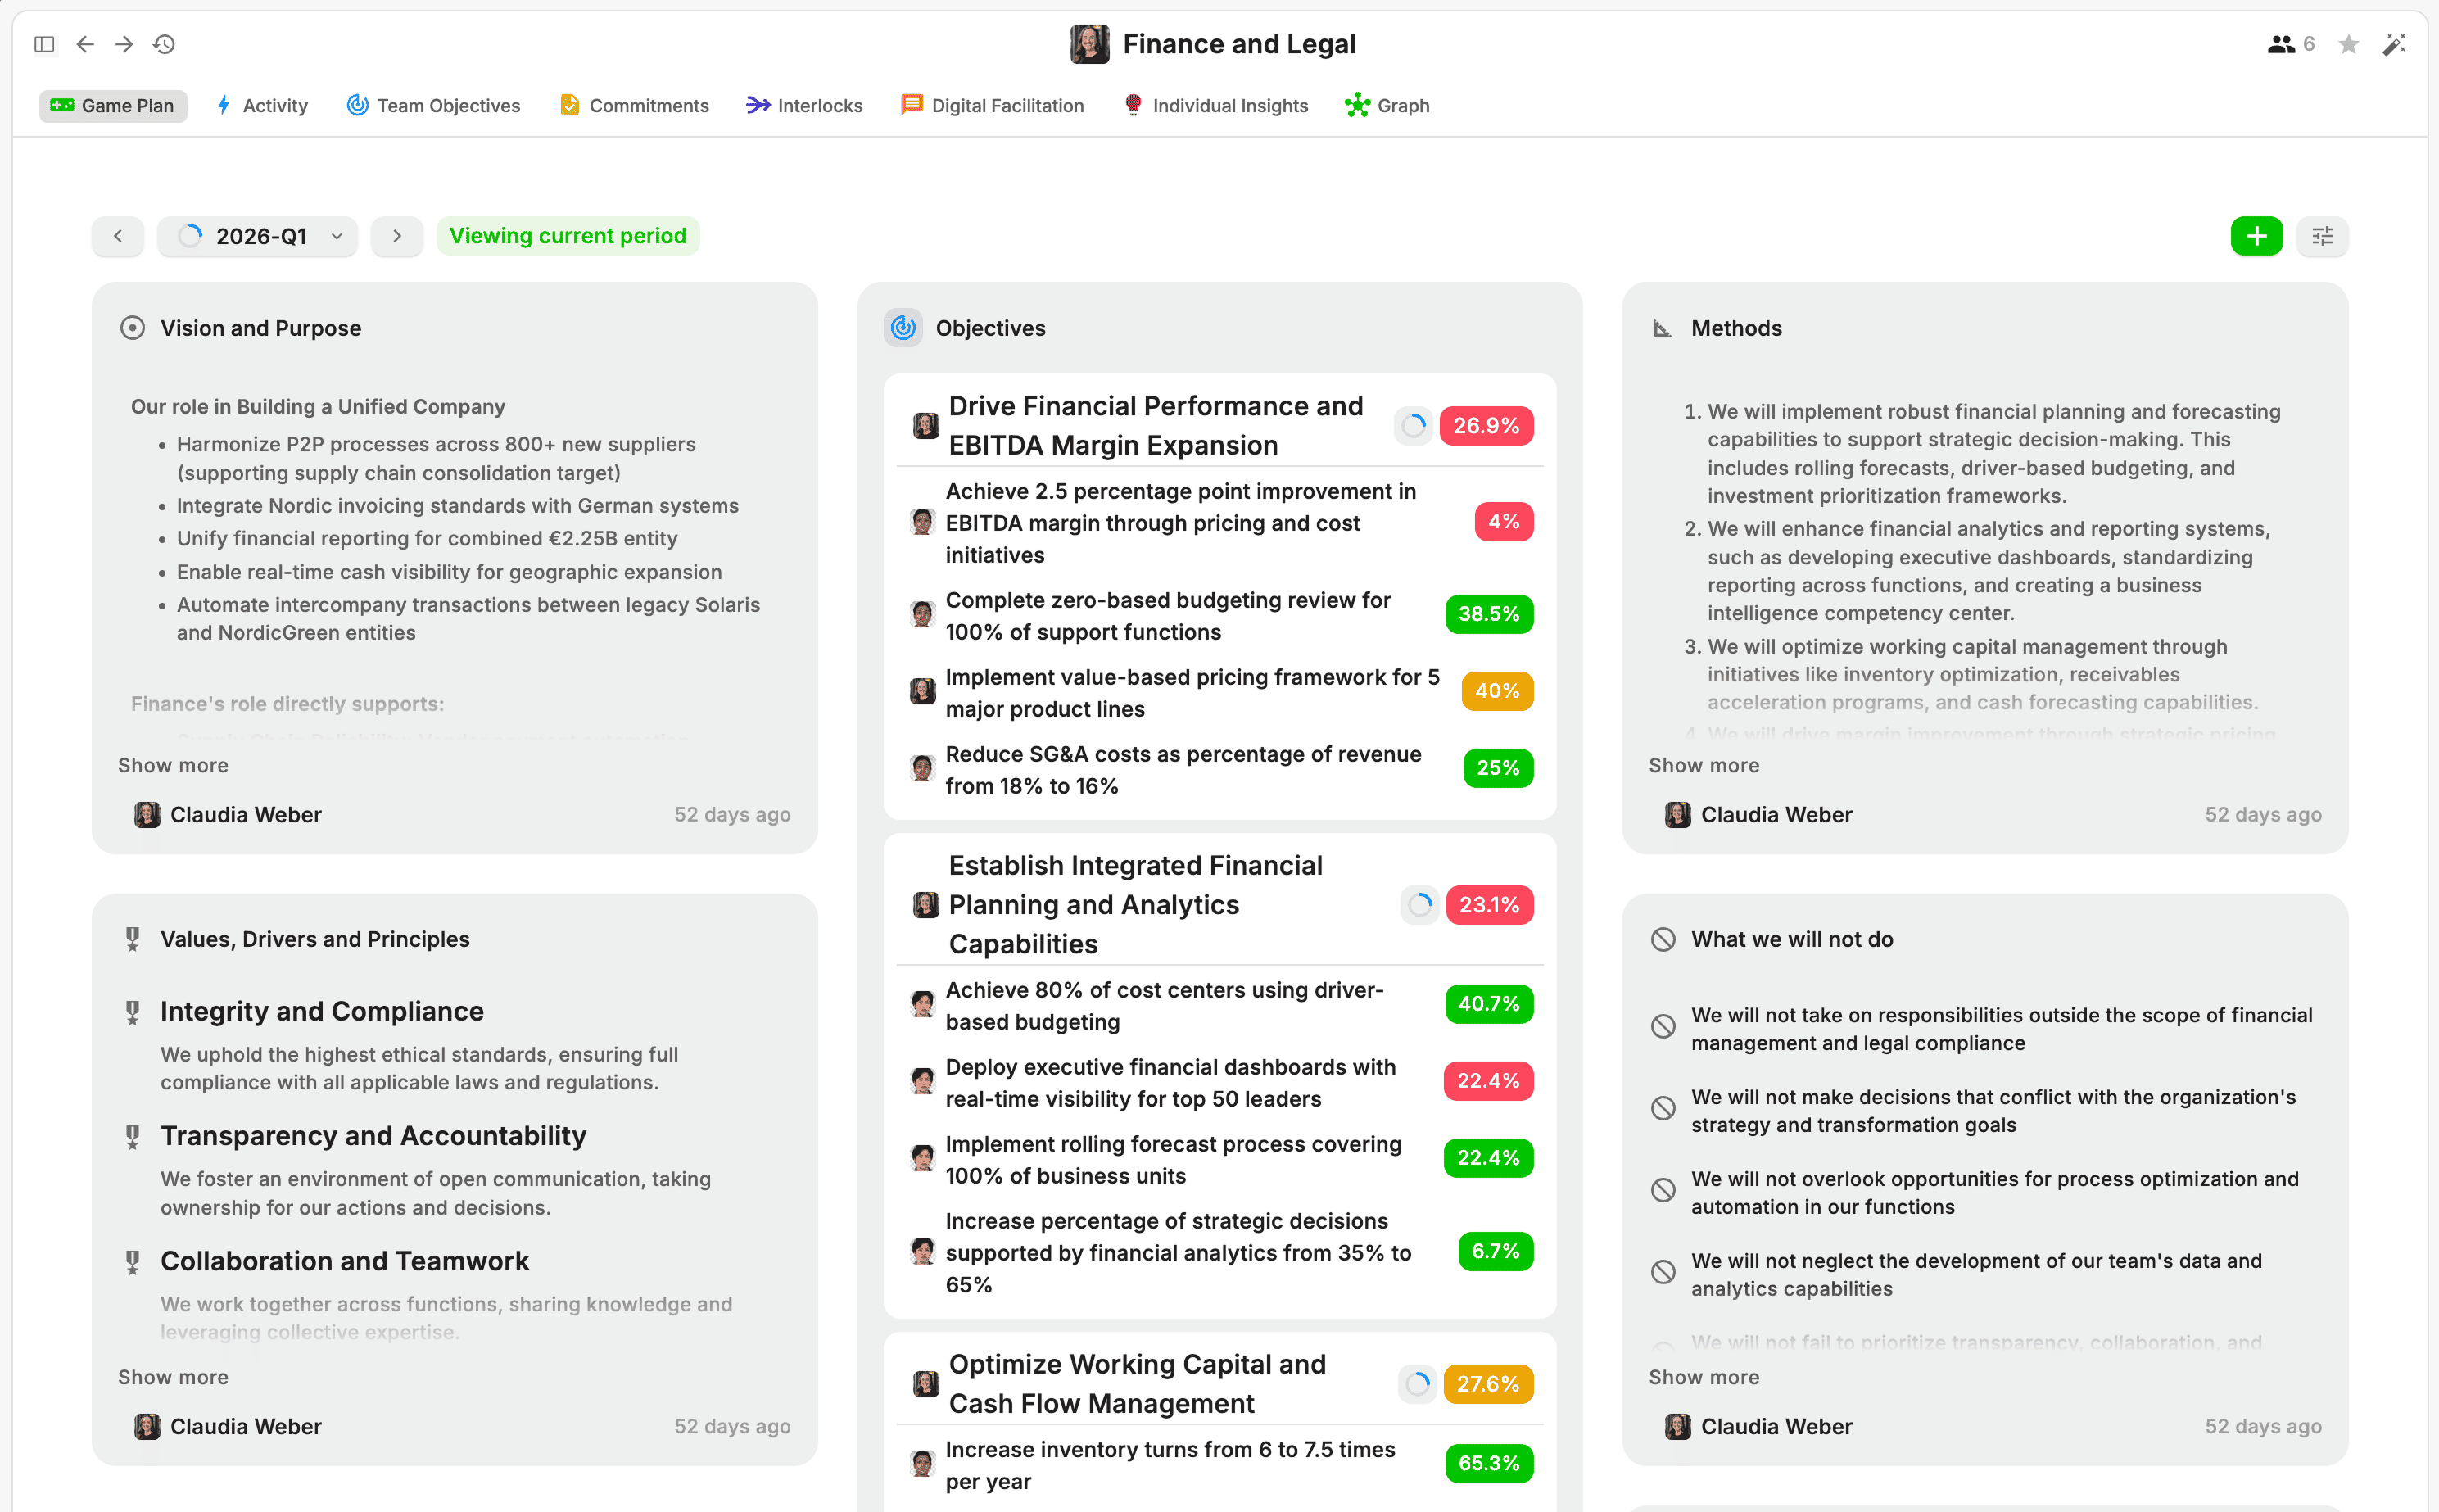
Game Plans
Every team's execution plan, aligned with strategy. Vision, methods, OKRs, commitments, and interlocks in one structured view.
OKRs
Objectives and key results with baseline, target, progress, and confidence. Vertical alignment from company to team level.
Confidence Scoring
Continuous measure of delivery confidence: all good, some hiccups, help needed. Updated through check-ins, not status reports.
Dependencies that resolve before they cascade
Cross-team dependencies are explicit: who needs what from whom, what’s blocked, what’s resolved. The organizational graph connects every commitment, objective, and dependency into one traversable structure. The alignment meetings that used to resolve this happen less, because both sides already see the connection.
Interlocks
Cross-team dependencies made explicit. Both sides see the connection, track status, and resolve before it blocks delivery.
Commitments
Ownable deliverables with contributor roles and OKR linkage. Clear lifecycle from pending to completed.
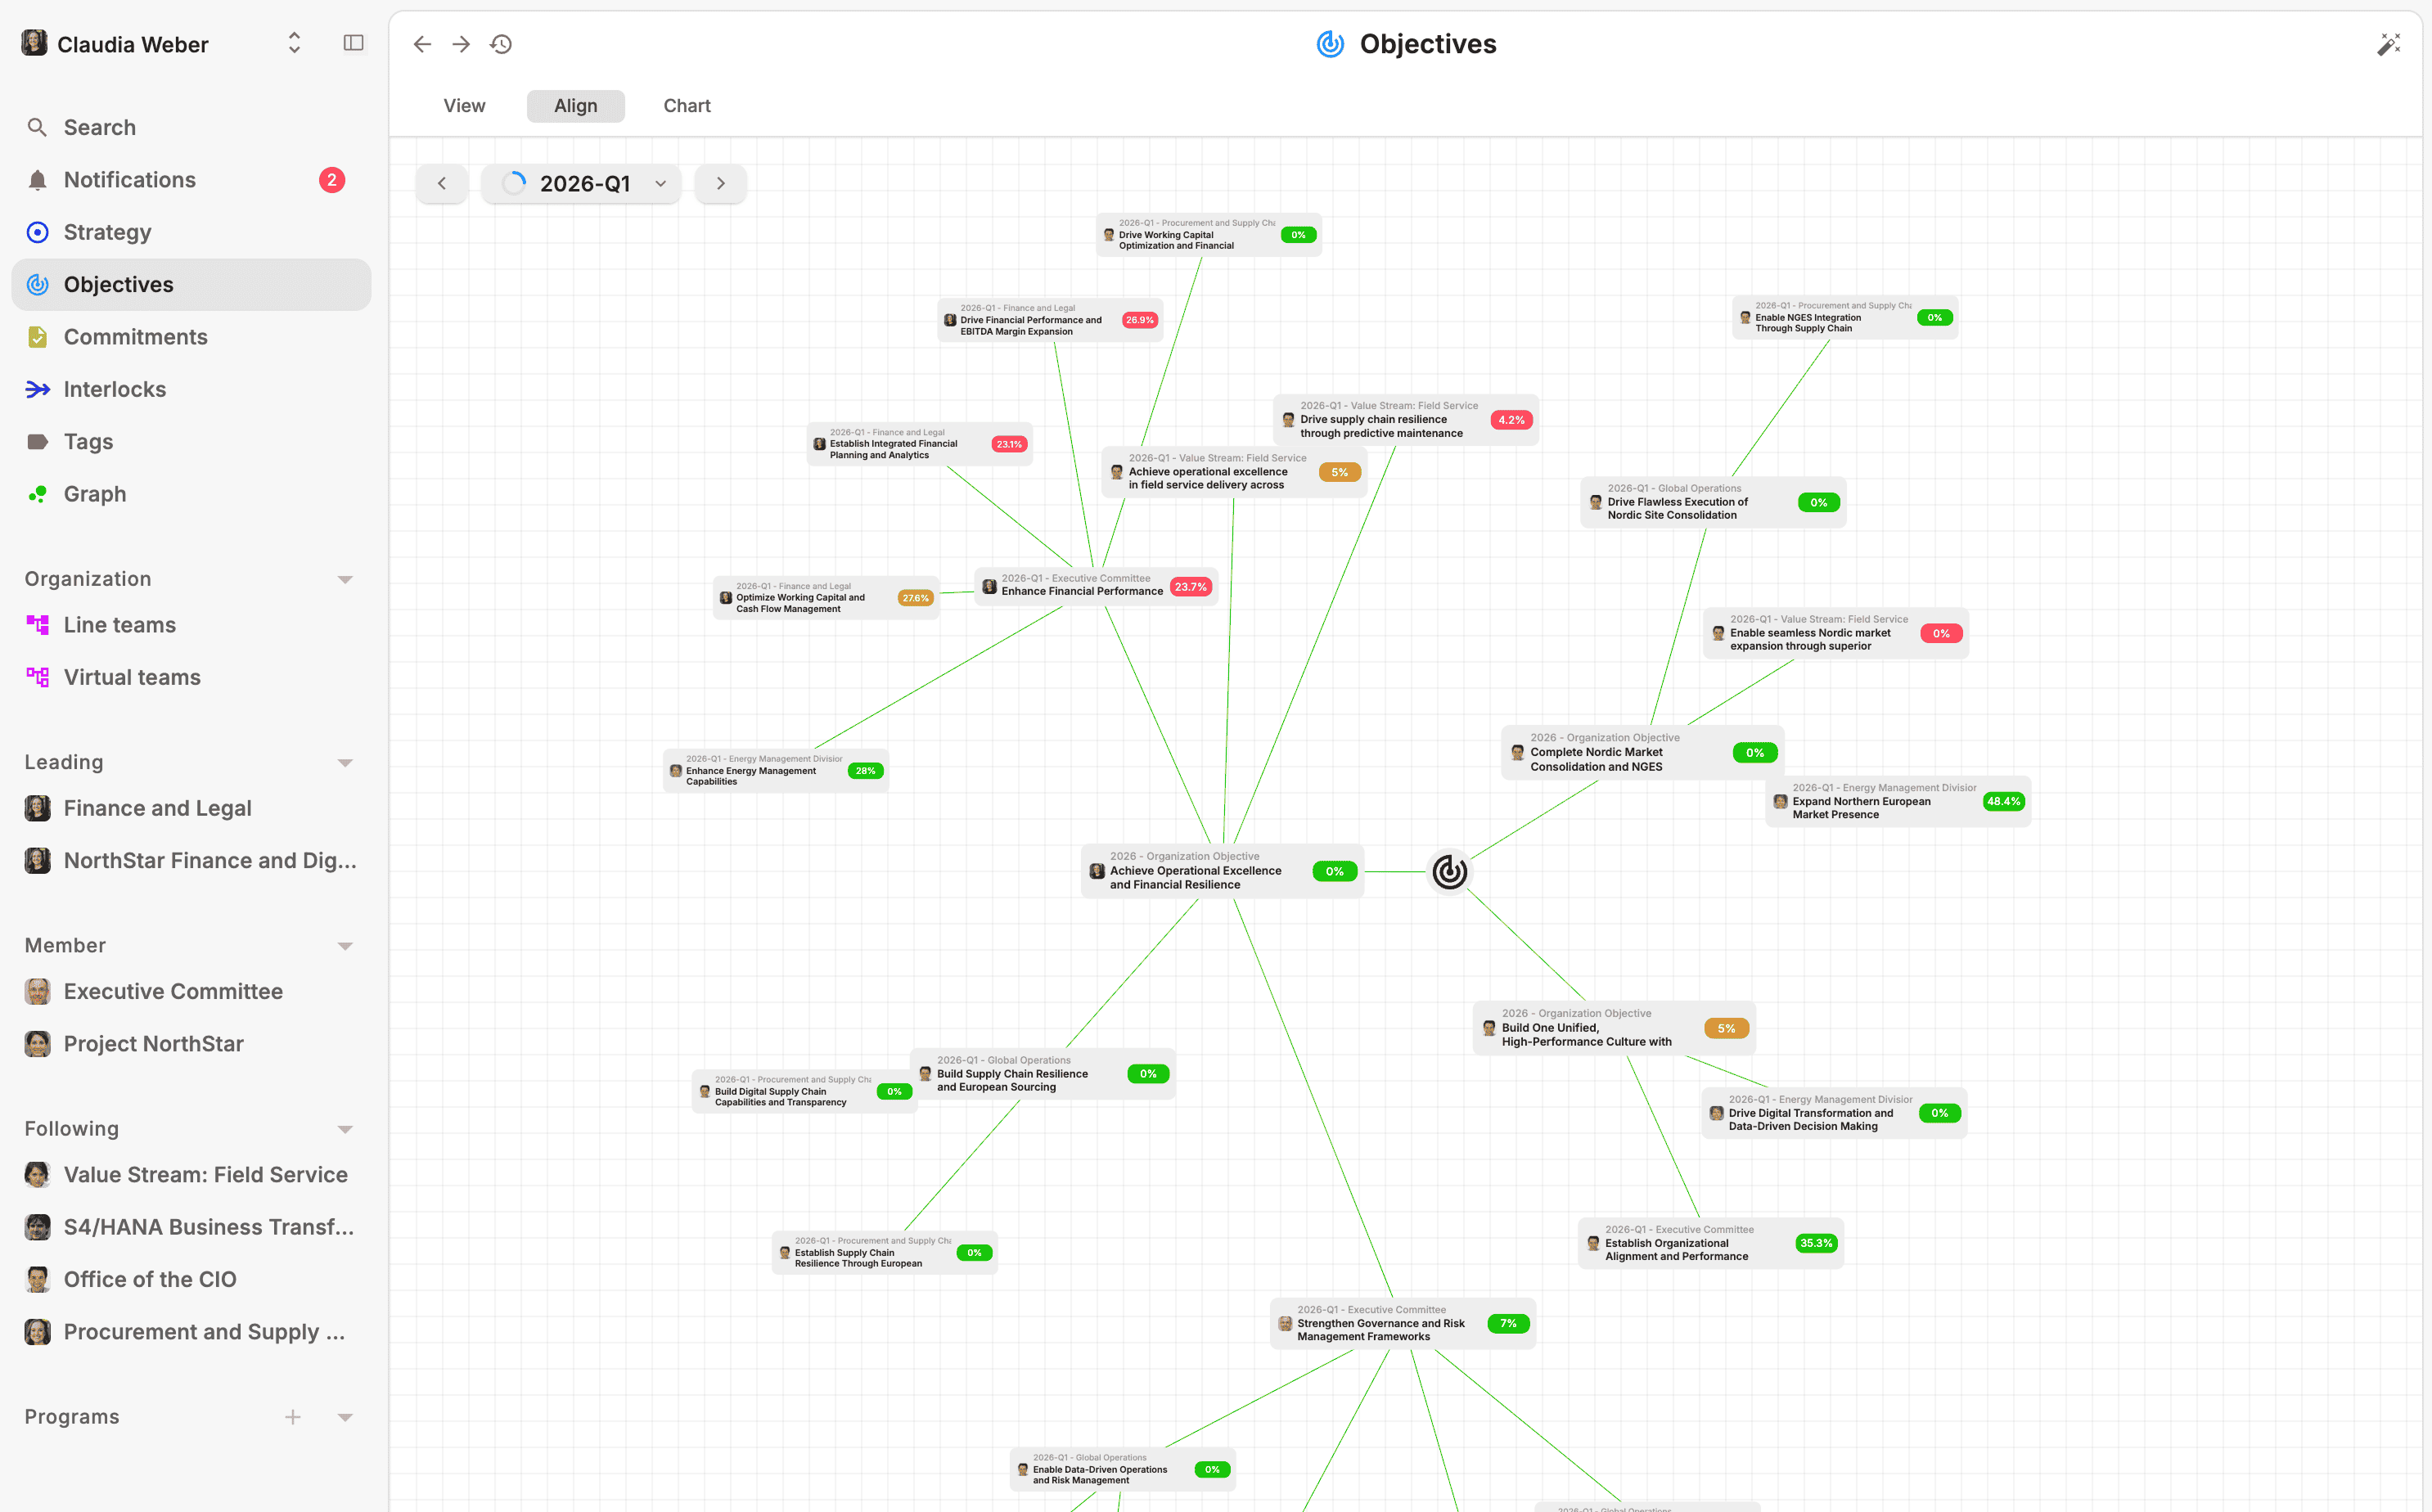
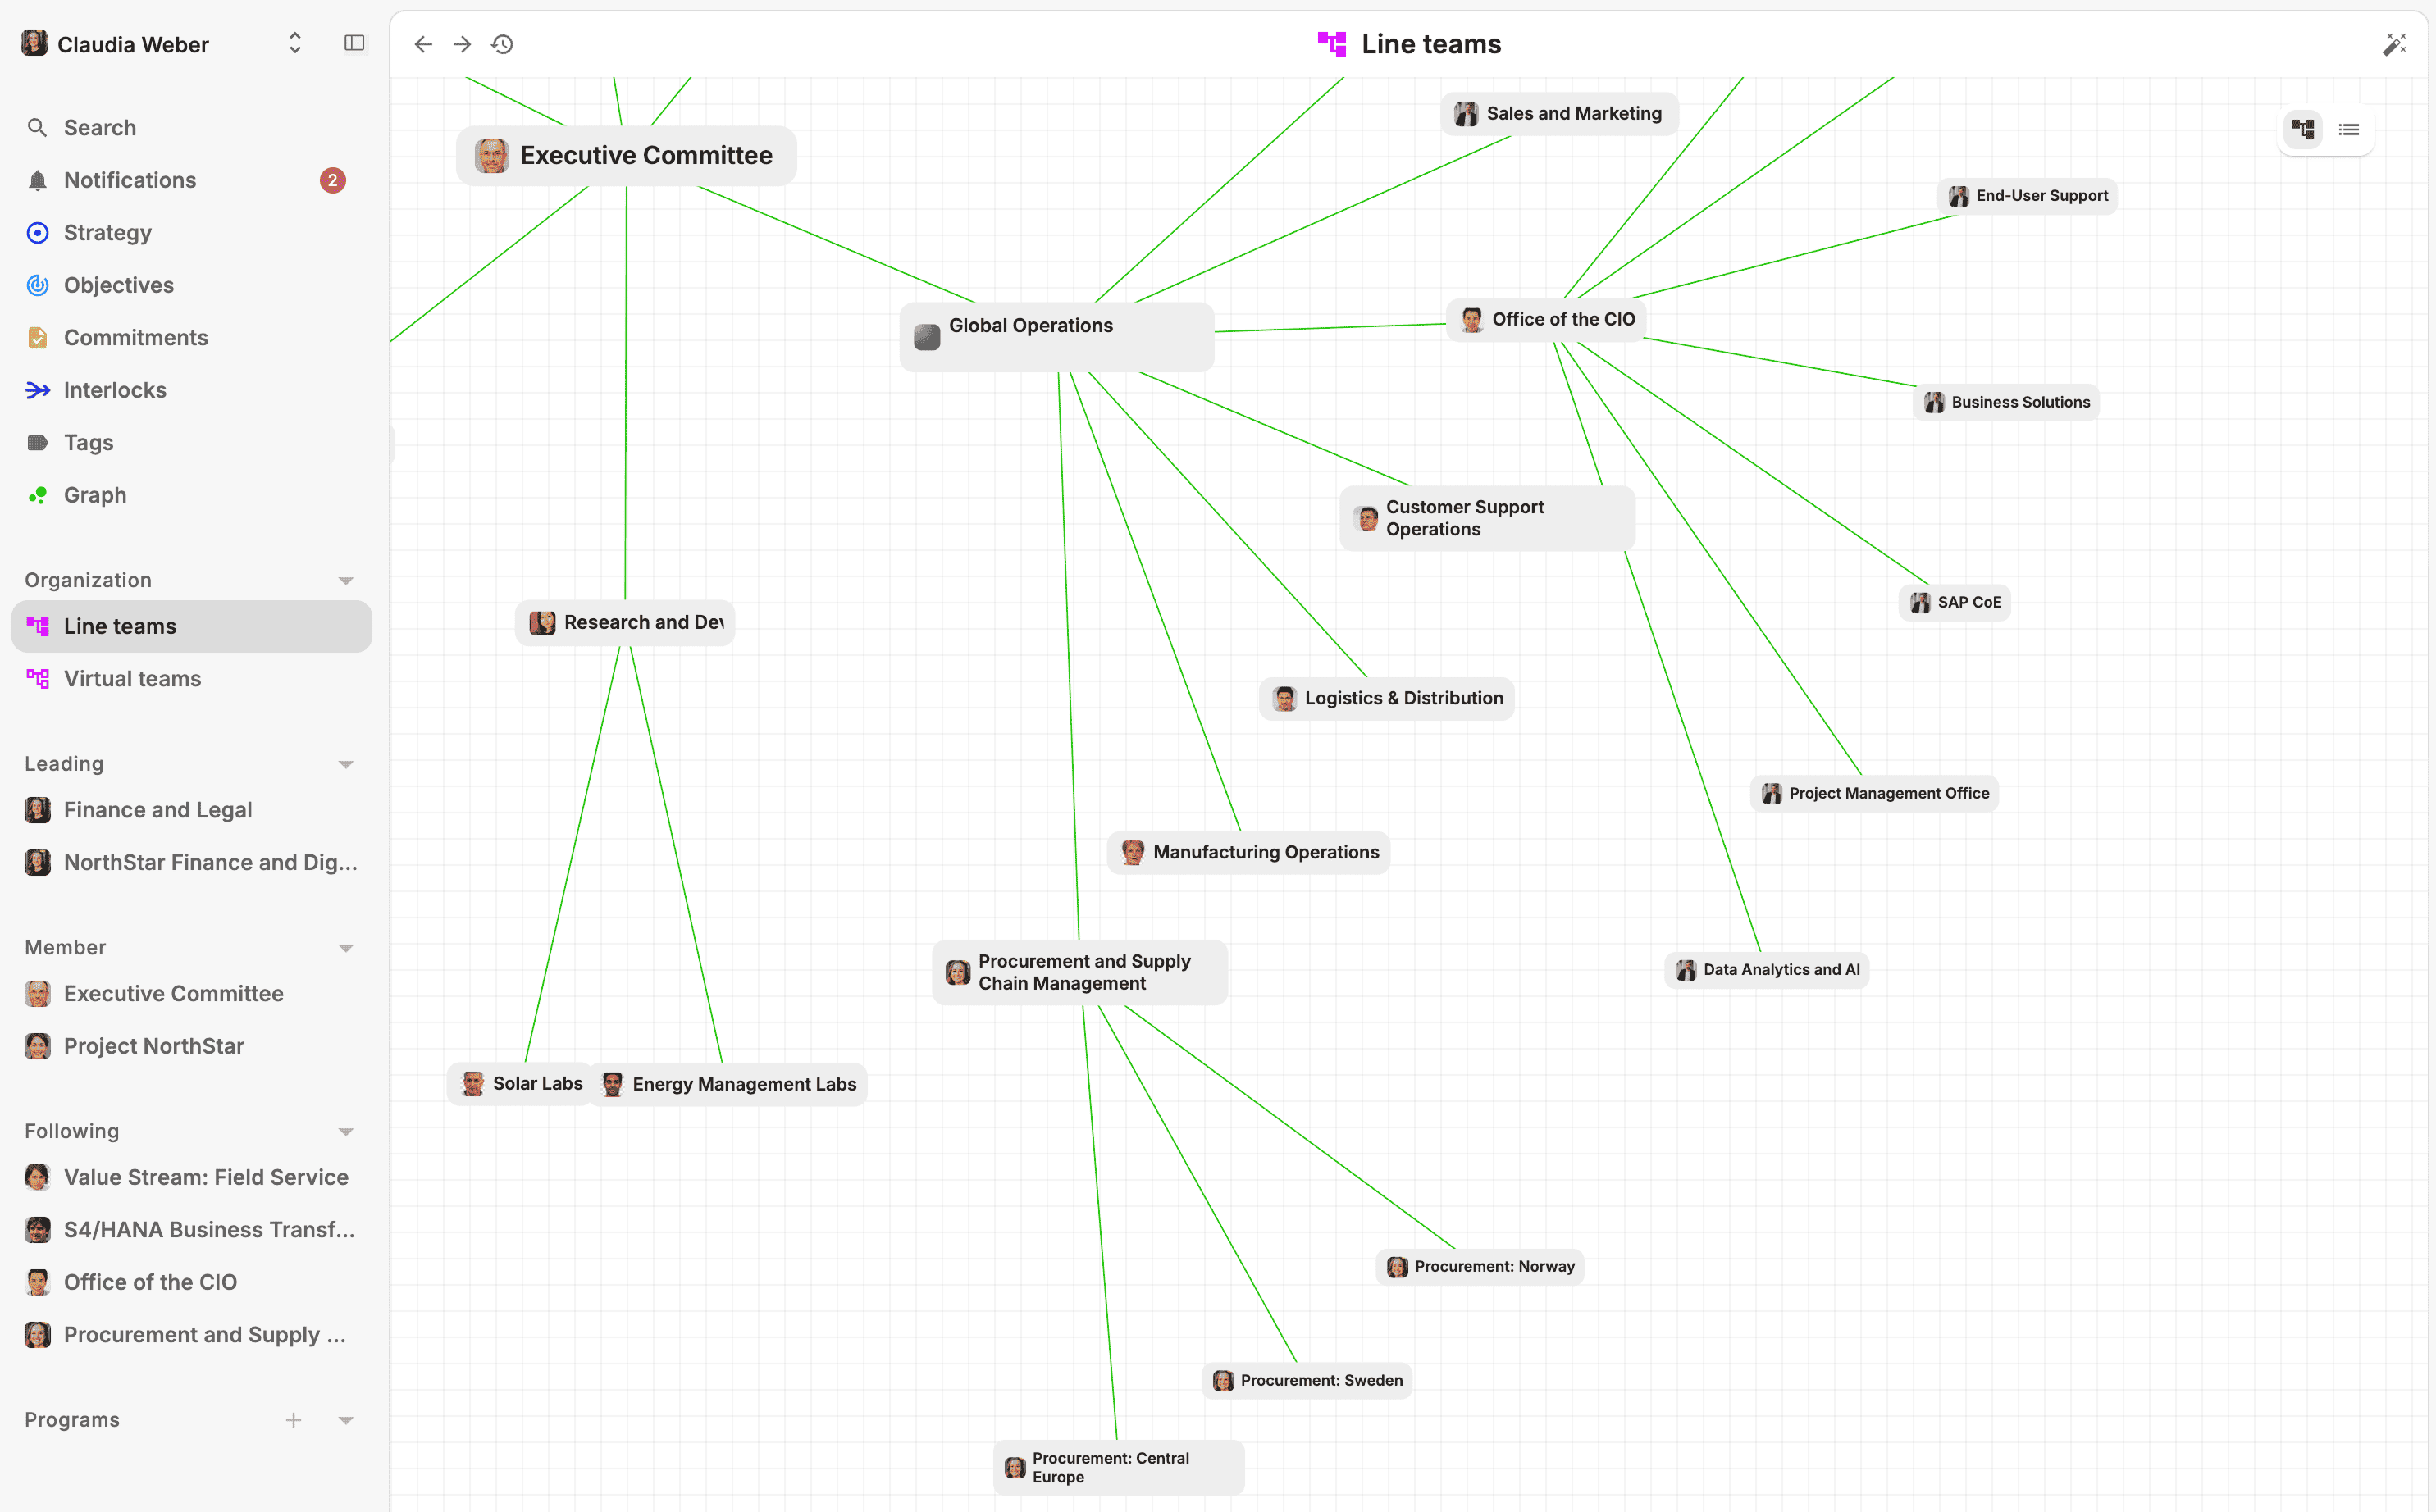
Strategy Execution Map
Interactive graph visualization. Every entity explorable, every relationship visible. Click through the full dependency chain.
Integrations
Jira, SAP Signavio, Slack, Planner, Asana. External work items appear as first-class nodes in the organizational graph.
Every investment traceable to a strategic choice
Every work item is continuously classified: needs attention, progressing, gone silent, recently completed. When a dependency degrades in one team, the impact surfaces immediately on every connected objective. Most teams are fine. A few aren’t. The signal is already there before anyone reports it.
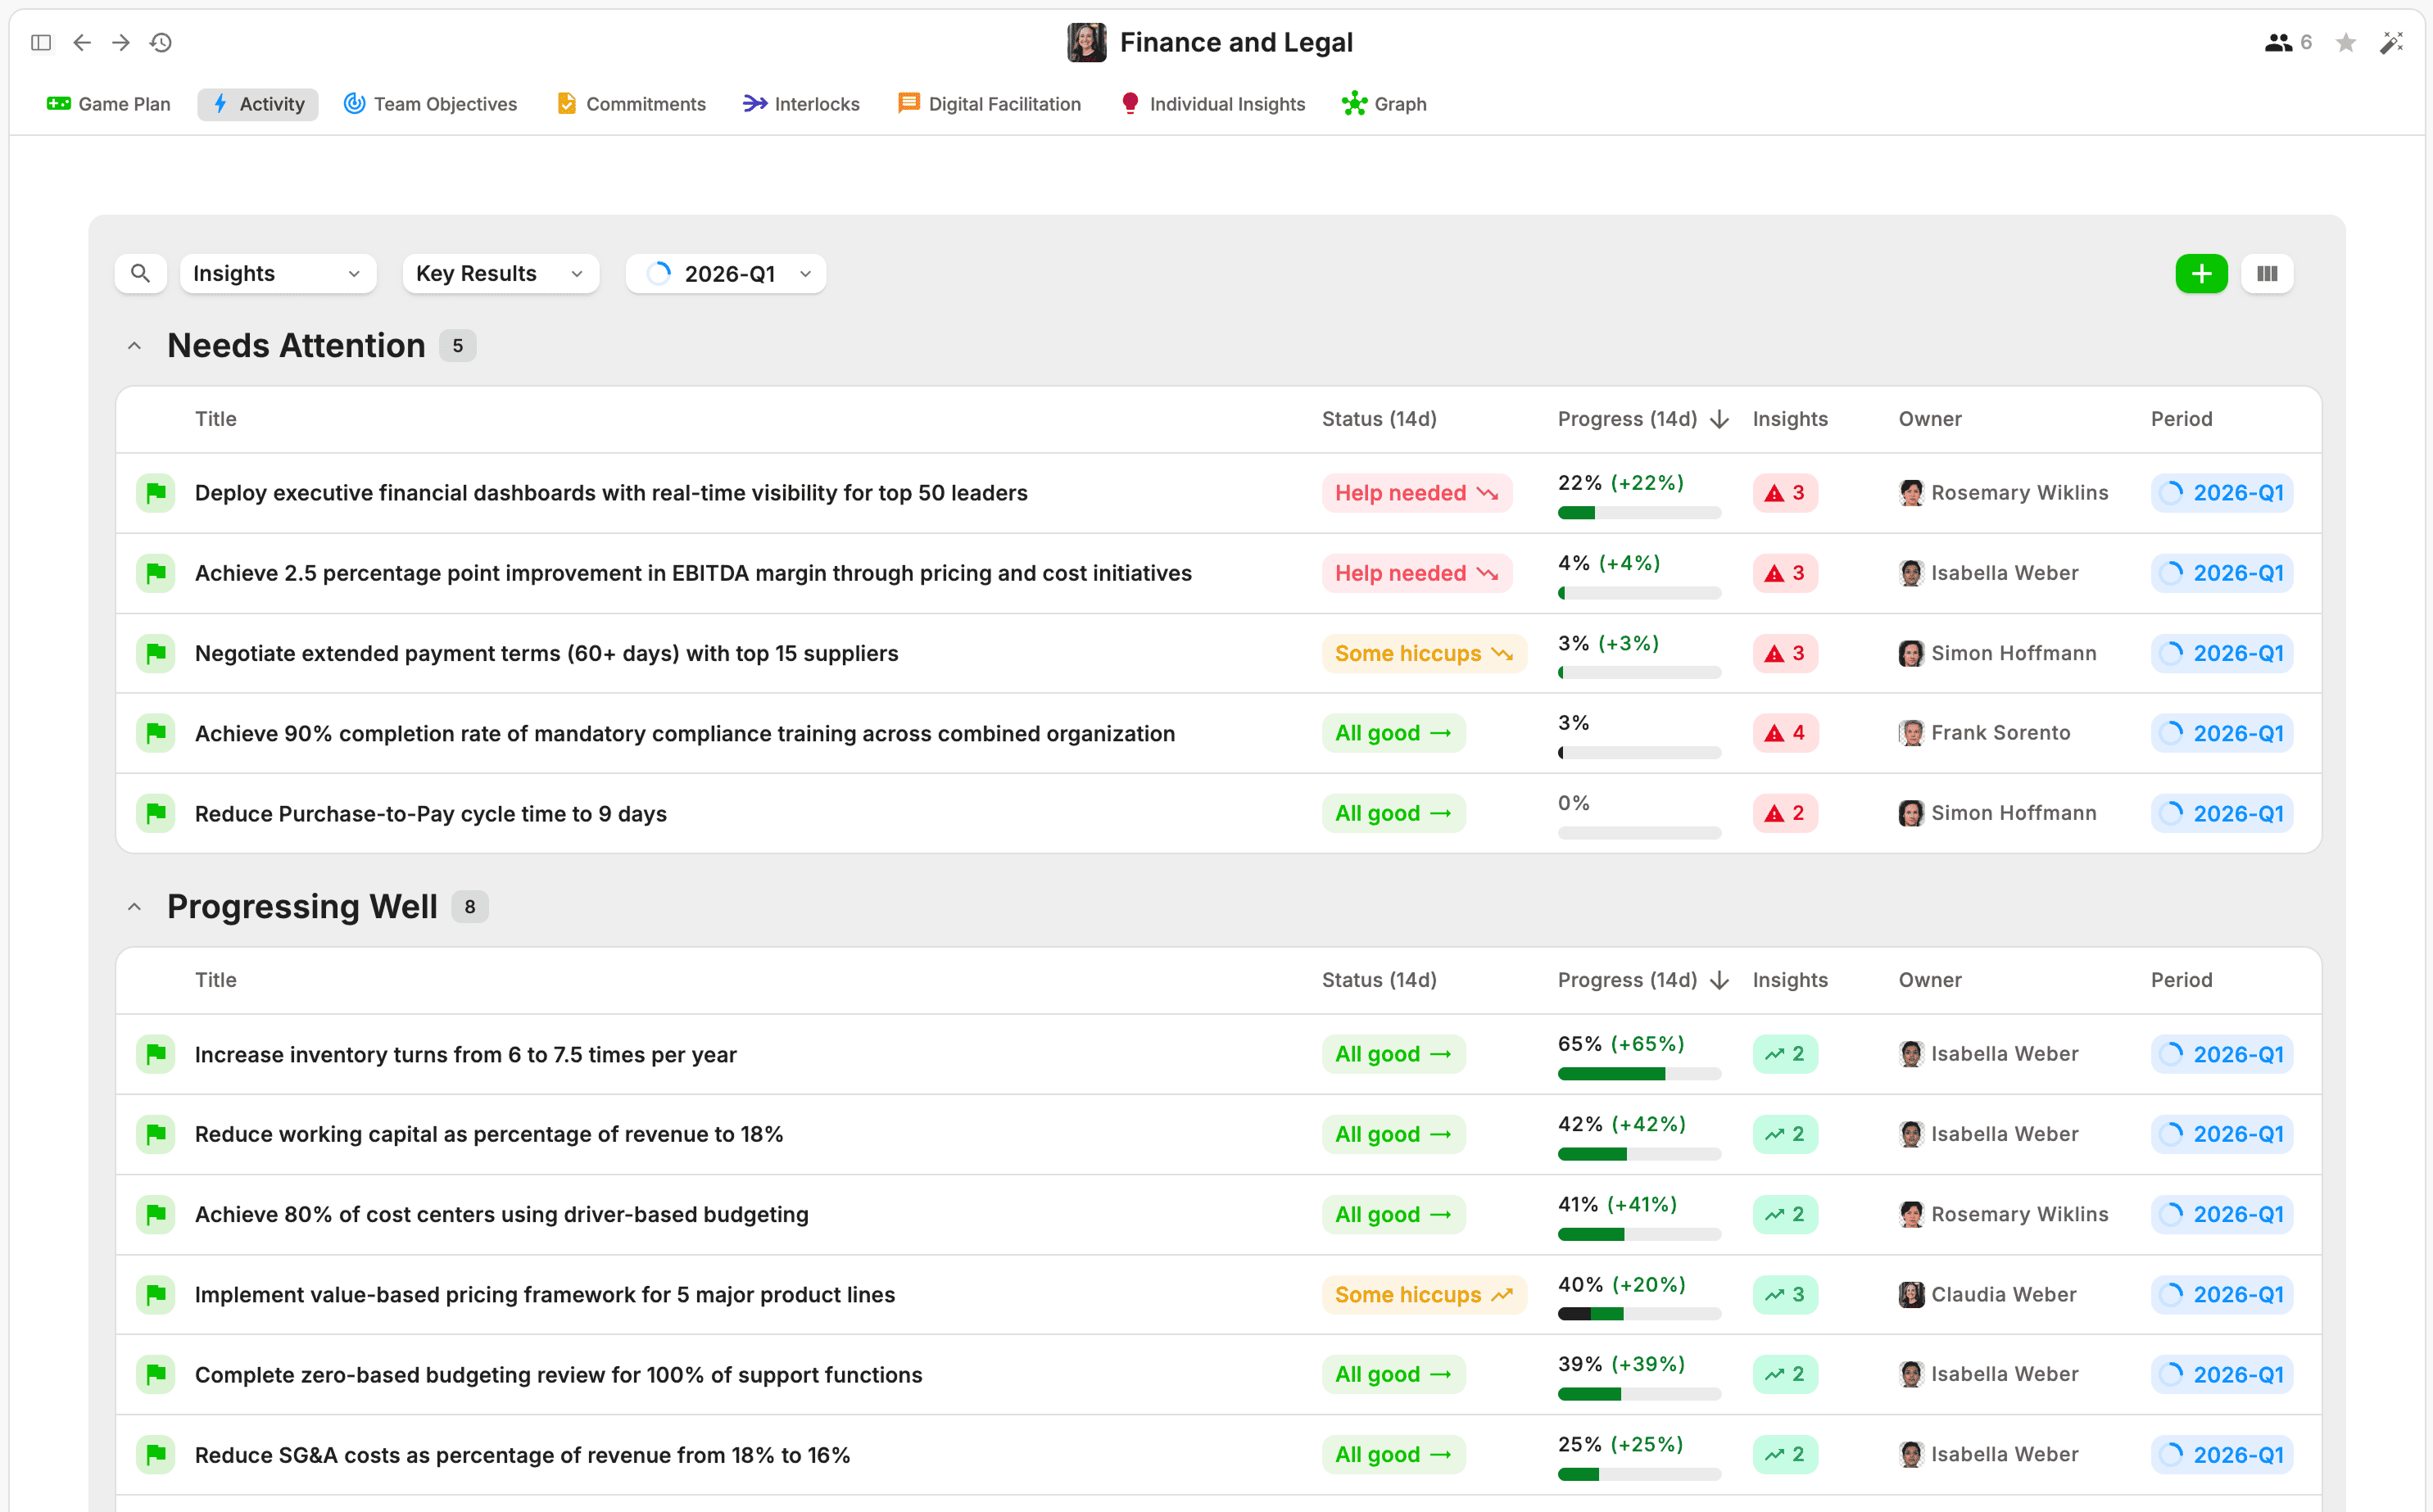
Activity View
Every work item continuously classified: progressing, needs attention, gone silent. Configurable time windows. Cross-team ripple effects surfaced automatically.
Check-ins
Progress and confidence updates on key results. The pulse of execution health, captured where the work happens.
Traceability
Any work item traces back to the strategic choice that funded it. When the board asks why, the answer is already in the graph.
Execution Signal
Execution health surfaces continuously from the structure itself. No one needs to assemble the picture for the next steering.
Transformation governed from one picture
Cross-workstream dependencies visible before they cascade. Activity data shows which teams are engaging, which have gone quiet, where intervention is needed. Consulting output stays connected after the engagement ends. Process intelligence surfaces in the context of strategic decision-making. Your next transformation starts where this one finishes.
Cross-workstream Governance
Dependencies between transformation workstreams visible before they cascade. Activity signals across the full program.
Process Intelligence
SAP Signavio integration. Process reality surfaces in strategic context without needing a Signavio login.
Consulting Continuity
Partner output stays connected in the graph after engagements end. Methodology is the workflow, not a separate training.
Digital Facilitation
QBRs, check-ins, and Game Plan workshops run inside the platform. Sessions structured, outcomes captured, actions linked.
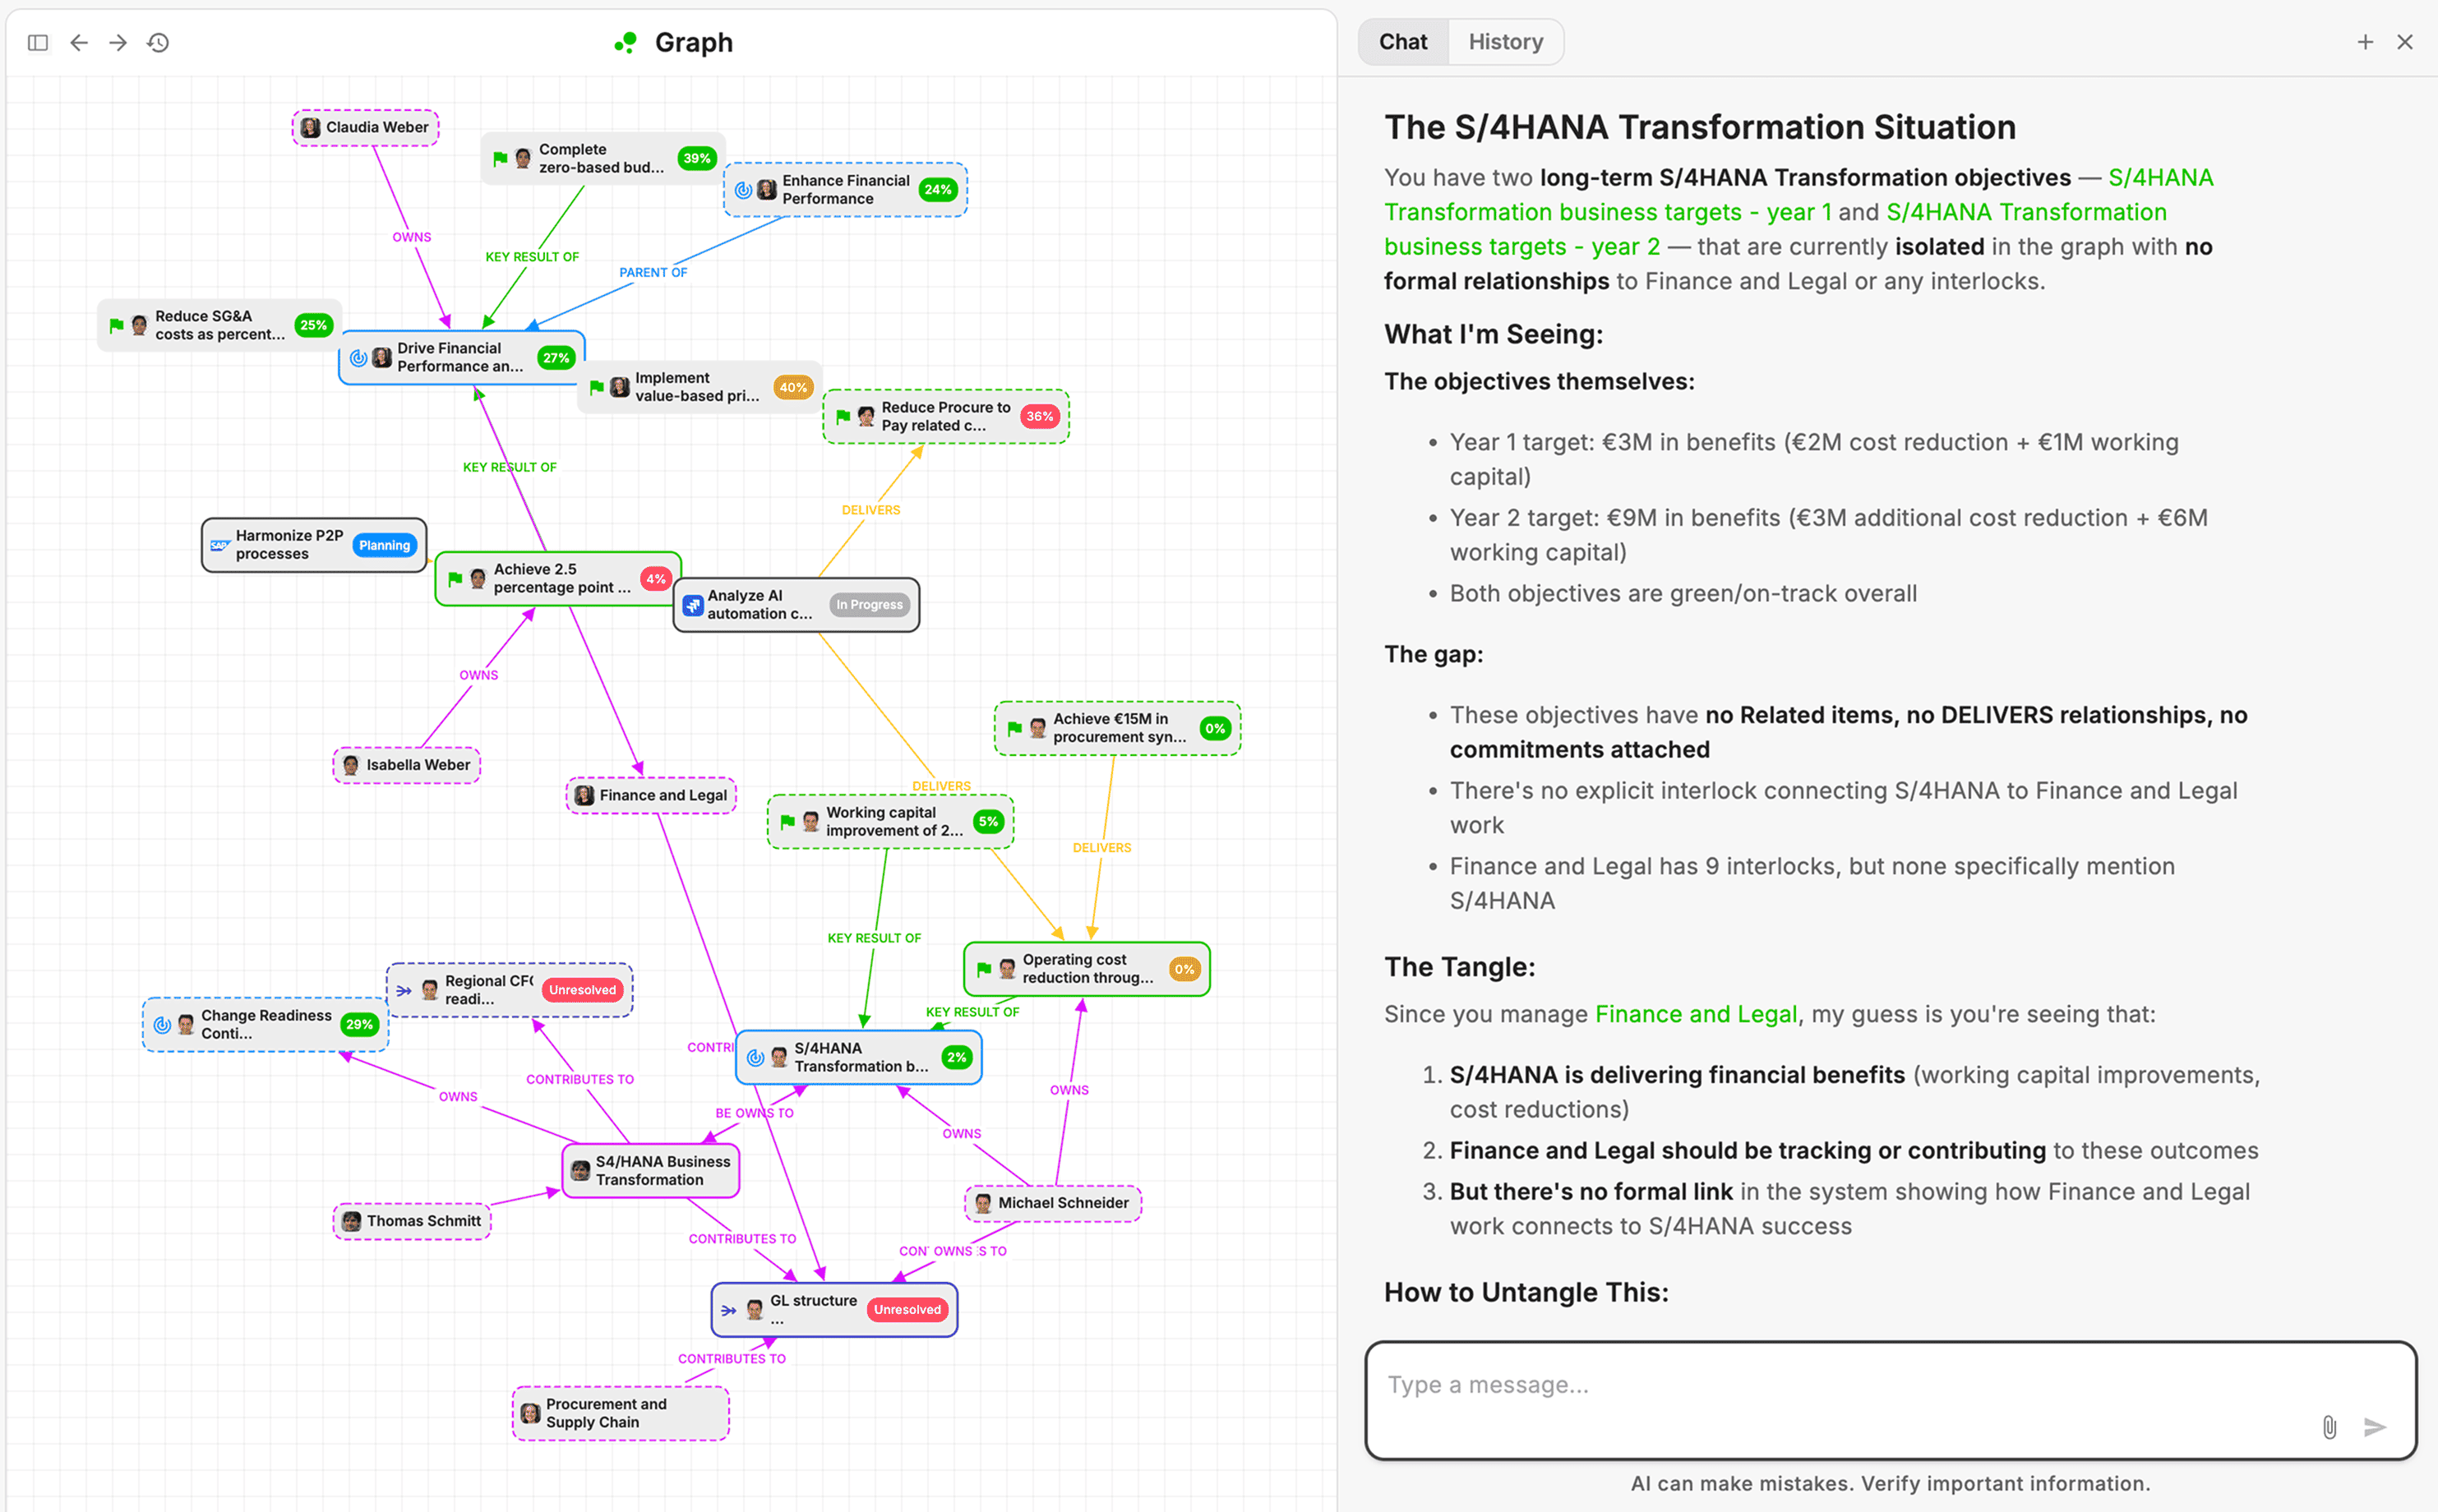
AI-Powered Executive Advisor
Traverses the full organizational graph.
Every question above, answered in one conversation. Traced answers with a recommendation, grounded in the actual state of your organization.
Which strategic choices have lost momentum this quarter?Why this works
The connection between strategy and execution is now a layer in the stack.
Methodology built in
Playing to Win, Game Plans, confidence scoring, digital facilitation. The way your teams work is the way the platform works.
Partners who’ve done this before
BearingPoint, cbs consulting, and others bring the transformation experience. We bring the platform.
Enterprise-grade from day one
ISO27001. GDPR. SSO/SCIM. API-first. Connects to Jira, Slack, HR systems, SAP Store.
Gets sharper over time
Every quarter deepens the organizational graph. Every team enriches the picture. Your next transformation starts where this one finishes.
Start with one team. Strategy connected to execution in 14 days.
We use your actual strategy and your actual tools. Our partners have done this before.